About
The retinotopic mapping package is a self-contained module for display visual stimuli in visual physiology experiments and for data analysis on the results of those experiments.
The visual stimuli generation and display is implemented in the modules
MonitorSetup.py, StimulusRoutines.py and DisplayStimulus.py.
These modules allow you to display flashing circle, sparse noise,
locally sparse noise, drifting grading circle, static grading circle
and others with spherical correction. The method for spherical
correction is the same as Marshel et al. 2011 (2). These stimulus
routines are highly customizable and designed to give the user
significant flexibility and control in creative experimental design.
Please check the ‘examplesvisual_stimulation’ folder for example script example_stimulation.py of visual stimulation.
One specific analysis this package can perform is automated
segmentation of the mouse visual cortex, which is implemented in
RetinotopicMapping.py module.
The experimental setup and analysis routine was
modified from Garrett et al. 2014 (1), and closely follows
the protocols and procedures documented in Juavinett et al. 2016
(2).
The analysis takes visual altitude and azimuth maps of mouse cortex as inputs, calculates the visual sign of each pixel and auto-segments the cortical surface into primary visual cortex and multiple higher visual cortices. Ideally, the visual altitude and azimuth maps can be generated by fourier analysis of population cortical responses to periodic sweeping checker board visual stimuli (3, 4).
The package also provides some useful plotting functions to visualize the results.
Please check the ‘examplessignmap_analysis’ folder for a jupyter notebook showing automated visual area segmentation of mouse cortex.
What is a retinotopic map?
Retinotopic maps are a common tool used in systems neuroscience to understand how receptive fields are mapped onto particular regions of the brain. In the lower visual areas of certain species, neurons are organized as a 2D representation of the visual image that is formed on the retina.
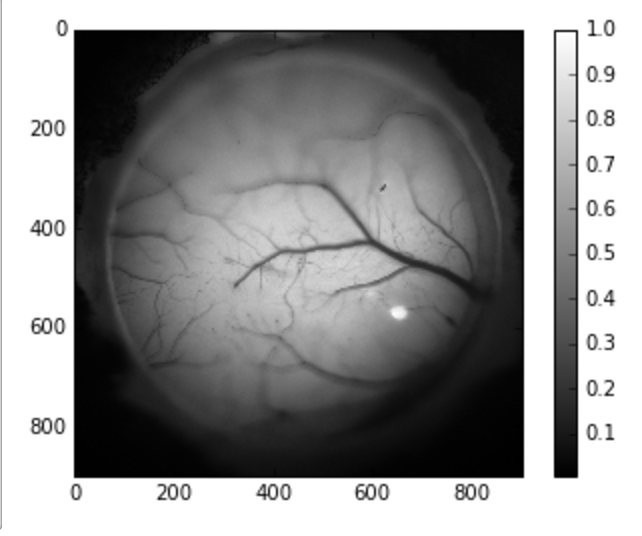
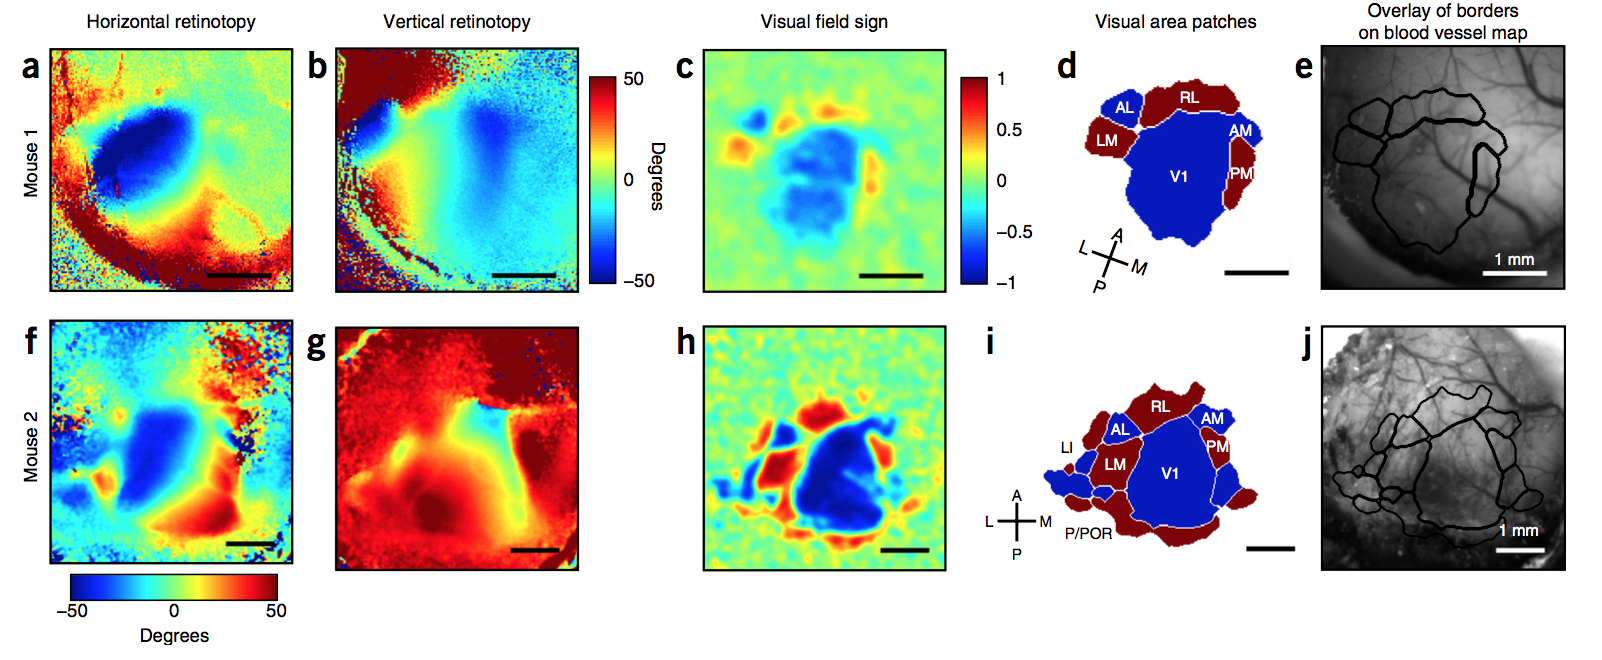
Image taken from (2) in Citations.
The following video gives an example of a retinopic map, showing how a moving dot is represented in the mouse brain.
Contributors
- Jun Zhuang @zhuang1981
- John Yearsley @jhyearsley
- Derric Williams @derricw
Citations
1. Garrett ME, Nauhaus I, Marshel JH, Callaway EM (2014) Topography and areal organization of mouse visual cortex. J Neurosci 34:12587-12600.
2. Juavinett AL, Nauhaus I, Garrett ME, Zhuang J, Callaway EM (2017). Automated identification of mouse visual areas with intrinsic signal imaging. Nature Protocols. 12: 32-43.
3. Kalatsky VA, Stryker MP (2003) New paradigm for optical imaging: temporally encoded maps of intrinsic signal. Neuron 38:529-545.
4. Marshel JH, Kaye AP, Nauhaus I, Callaway EM (2012) Anterior-posterior direction opponency in the superficial mouse lateral geniculate nucleus. Neuron 76:713-720.
5. Sereno MI, Dale AM, Reppas JB, Kwong KK, Belliveau JW, Brady TJ, Rosen BR, Tootell RB (1995) Borders of multiple visual areas in humans revealed by functional magnetic resonance imaging. Science 268:889-893.
6. Sereno MI, McDonald CT, Allman JM (1994) Analysis of retinotopic maps in extrastriate cortex. Cereb Cortex 4:601-620.